From 42 hours to 395
In the whole of 2025 the market clearing price (PTF) was zero in only 42 hours. In the first nine months of 2026 that number rose to 395. In the same months, evening prices still climbed above 4,000 TL/MWh. This price, which can run from zero to the cap within a single day, is the reference price of the Turkish power market.
An industrial supply contract, a solar plant’s agreement with an aggregator, an imbalance invoice and an electricity futures contract on Borsa İstanbul all depend on the same number: the PTF set for each hour in the day-ahead market (GÖP). Even inside the sector, how that number is formed is often understood only on the surface. “Where supply meets demand” is true, but it is not the whole answer.
An auction, not an exchange
The day-ahead market is run by the market operator EPİAŞ. In 2025, 229.9 TWh was matched there; by EPİAŞ’s account that makes it Europe’s third-largest day-ahead market by volume. On average 915 participants submitted bids each month.
The day-ahead market does not trade continuously like an exchange. All buy and sell bids for the 24 hours of the next day are collected until a fixed time and matched in one go. Each hour gets a single price, and everyone matched in that hour buys or sells at it.
This rule is called marginal pricing, and it shapes how participants bid. A plant that can generate at 500 TL/MWh sells at 2,000 if the price clears at 2,000 TL/MWh. Its best strategy is therefore to bid close to its own variable cost: a low bid secures a match, and the price is set by the last, more expensive plant. Bidding above cost only raises the risk of not being matched.
The PTF is the price of the most expensive megawatt needed to meet demand in that hour, not an average cost.
Times follow EPİAŞ’s operating calendar. The regulation text still shows earlier times, and EPİAŞ can shift the schedule on the day when needed.
Bid types: hourly, block and flexible
Bids are entered in lots of 0.1 MWh and priced to the kuruş between zero and the price cap. There are three bid types, and each brings a different physical reality to the market.
Within an hourly bid, the points between steps are joined linearly, so each participant’s bid is a piecewise-linear curve rather than a staircase. Adding up all the curves for an hour gives the market’s supply and demand curves.
The supply curve: plants in merit order
Sorting all sell bids for an hour from cheapest to most expensive gives the supply curve. This ranking is called the merit order. At the front are solar, wind and run-of-river plants, whose variable cost is close to zero. They are followed by lignite and imported coal, and finally by gas-fired plants.
Installed capacity is TEİAŞ data published in EPİAŞ’s daily bulletin of 5 October 2026; total 127.3 GW. Other sources (geothermal, biomass and others) are not shown.
A gas plant’s bid is driven mainly by its fuel cost. The tariff that BOTAŞ, the state gas company, charges power generators rose 20% on 4 April 2026 to 18,000 TL per 1,000 m³. At that tariff, the fuel cost alone of a plant with 50–55% efficiency is about 3,100–3,400 TL/MWh. Evening prices usually settle around or above this range; in August 2026 the 20:00 average was 4,197 TL/MWh.
Reservoir hydro plants bid on a different logic. They have no fuel cost, but the water in the reservoir is limited; water used today cannot be sold tomorrow. Their bids therefore reflect the price the water could earn later. In a dry period they save water for expensive hours; in a wet year like 2026 they bid low in more hours.
Demand, the crossing point and the algorithm
Buy bids come mostly from suppliers and large consumers. Because most consumers use electricity whatever the price, suppliers enter most of their forecast demand as price-independent buy bids. In most hours the demand curve is therefore almost vertical: demand barely responds to price, and the merit order on the supply side sets the price.
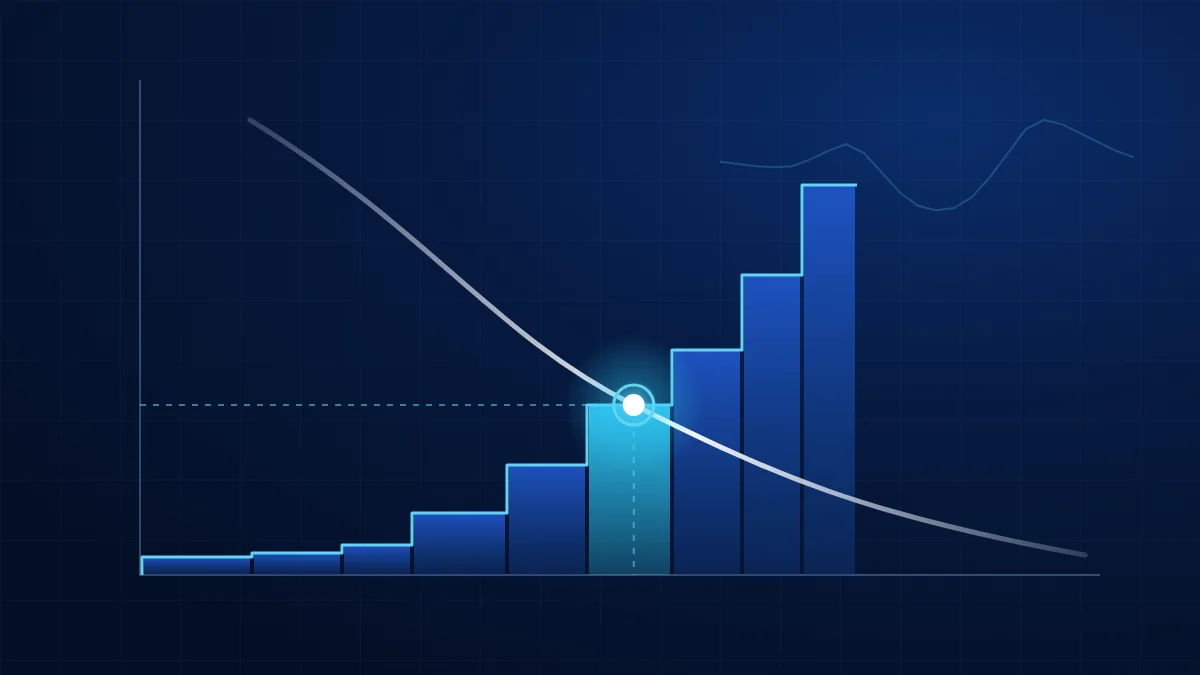
The matching algorithm looks for the solution that maximises total surplus: the gap between what buyers are willing to pay and what sellers are willing to accept. In the simple case this is where the two curves cross. The price at that point is the PTF, and the matched quantity is the market clearing quantity (PTM).
maximise Σₛ [ Buyₛ − Sellₛ ]
Σ accepted buyₛ = Σ accepted sellₛ (for every hour s)
PTFₛ = the price at which the hour balances
The example below shows how the same set of bids clears in two different hours. In the evening there is no solar, and meeting demand reaches the efficient gas plants. At midday 20,000 MW of solar comes online and zero-priced bids cover all of demand.
Illustrative calculation. Quantities are round numbers close to the size of the Turkish system; gas bids are based on fuel cost at BOTAŞ’s 4 April 2026 tariff and 50–55% efficiency. The real market has hundreds of bids each hour, plus block and flexible bids.
At 20:00 demand is met within the 7,000 MW step of efficient gas plants; the price is 3,100 TL/MWh and the zero-cost plants also sell at that price. At 12:00 zero-priced supply exceeds demand by 1,000 MW. The price is zero and the surplus bids are curtailed pro rata.
Block and flexible bids make the calculation harder because they link hours: accepting a block changes the price in other hours. The Turkish rule is the reverse of the European one. Unless bids are being curtailed, a block whose price is better than the average PTF of its hours cannot be rejected. Some blocks may instead be accepted at a loss; the difference is covered by a charge collected from day-ahead participants. For this reason the PTF can differ slightly from the simple crossing of the hourly curves.
Why the price changes hour by hour
Demand moves during the day, but what really changes is the shape of supply. On a sunny spring day, zero-cost generation can cover all of demand at midday; coal and gas plants are never reached and the PTF falls to zero. After sunset, the gas plants at the end of the order are needed to meet the same demand, and the price rises by thousands of lira within a few hours.
The pattern grows stronger every year. Installed solar capacity rose from 24.8 GW at the end of 2025 to 28.1 GW in October 2026, and a wet 2026 added cheap hydro supply. In May 2026 the monthly average PTF fell to 591 TL/MWh and the 12:00 average to 23 TL/MWh. Evening prices, meanwhile, remain tied to the cost of gas.
Floor, cap and curtailment
The PTF is set between two limits. The floor is 0 TL/MWh; Türkiye has no negative prices. The cap is set by EMRA (EPDK): it became 3,000 TL/MWh on 1 July 2024, 3,400 TL/MWh on 5 April 2025 and 4,500 TL/MWh on 4 April 2026. The same limits apply in the balancing market. Intraday limits are these values multiplied by the imbalance coefficients, so intraday prices can exceed 4,500.
The limits stop the price, but they do not balance the market by themselves. If supply exceeds demand at zero, sell bids are curtailed pro rata; if demand exceeds supply at the cap, buy bids are curtailed. In 2025 the PTF sat at the cap for 1,023 hours; in 2026 the higher cap and more cheap supply brought that number down sharply.
Hours at the cap for January–August come from EPİAŞ monthly reports. Zero-price hours and the September cap count were calculated from hourly data in EPİAŞ daily bulletins.
Where the PTF is used
The price set in the day-ahead market is the starting point for every calculation after delivery. In 2025, 60.5% of wholesale electricity trading was done through bilateral contracts and 37.9% in the day-ahead and intraday markets, but most bilateral contracts also tie their price to the PTF.
From an investor’s perspective
A plant’s revenue is set not by the annual average PTF but by the PTF in the hours it generates. A solar plant generates when prices are lowest; in 2025 the sales-weighted price of solar plants was about 84% of the market average, and the zero-price hours of 2026 are pushing that ratio lower. Investment decisions should use a price weighted by the plant’s generation profile, not an average price assumption.
The second point is regulation. The price cap, the imbalance coefficients and the gas tariff directly change the level and volatility of the PTF; on 4 April 2026 the cap and the gas tariff changed on the same day. In a long-term contract or a financing model, assuming from the start that these parameters will change matters more than asking “will prices go up?”.
At Frekans we model the next day’s hourly PTF together with the generation forecast for every plant we manage, and build the bid structure around both forecasts. For projects at the investment stage, we work with price scenarios weighted by each plant’s generation profile rather than with annual averages.